

On this page
DevWorkspace Pro is a desktop app for macOS, Windows and Linux with uptime monitoring: you add a URL in the Health tab of a project, our servers check it, and you get an email when it stops. It costs $9 a month, $95 a year or $499 once.
The monitor sits with the project it belongs to, next to the code and the logs. When a monitor is down, the Health tab of that project shows a red dot, so you see it when you open the app.
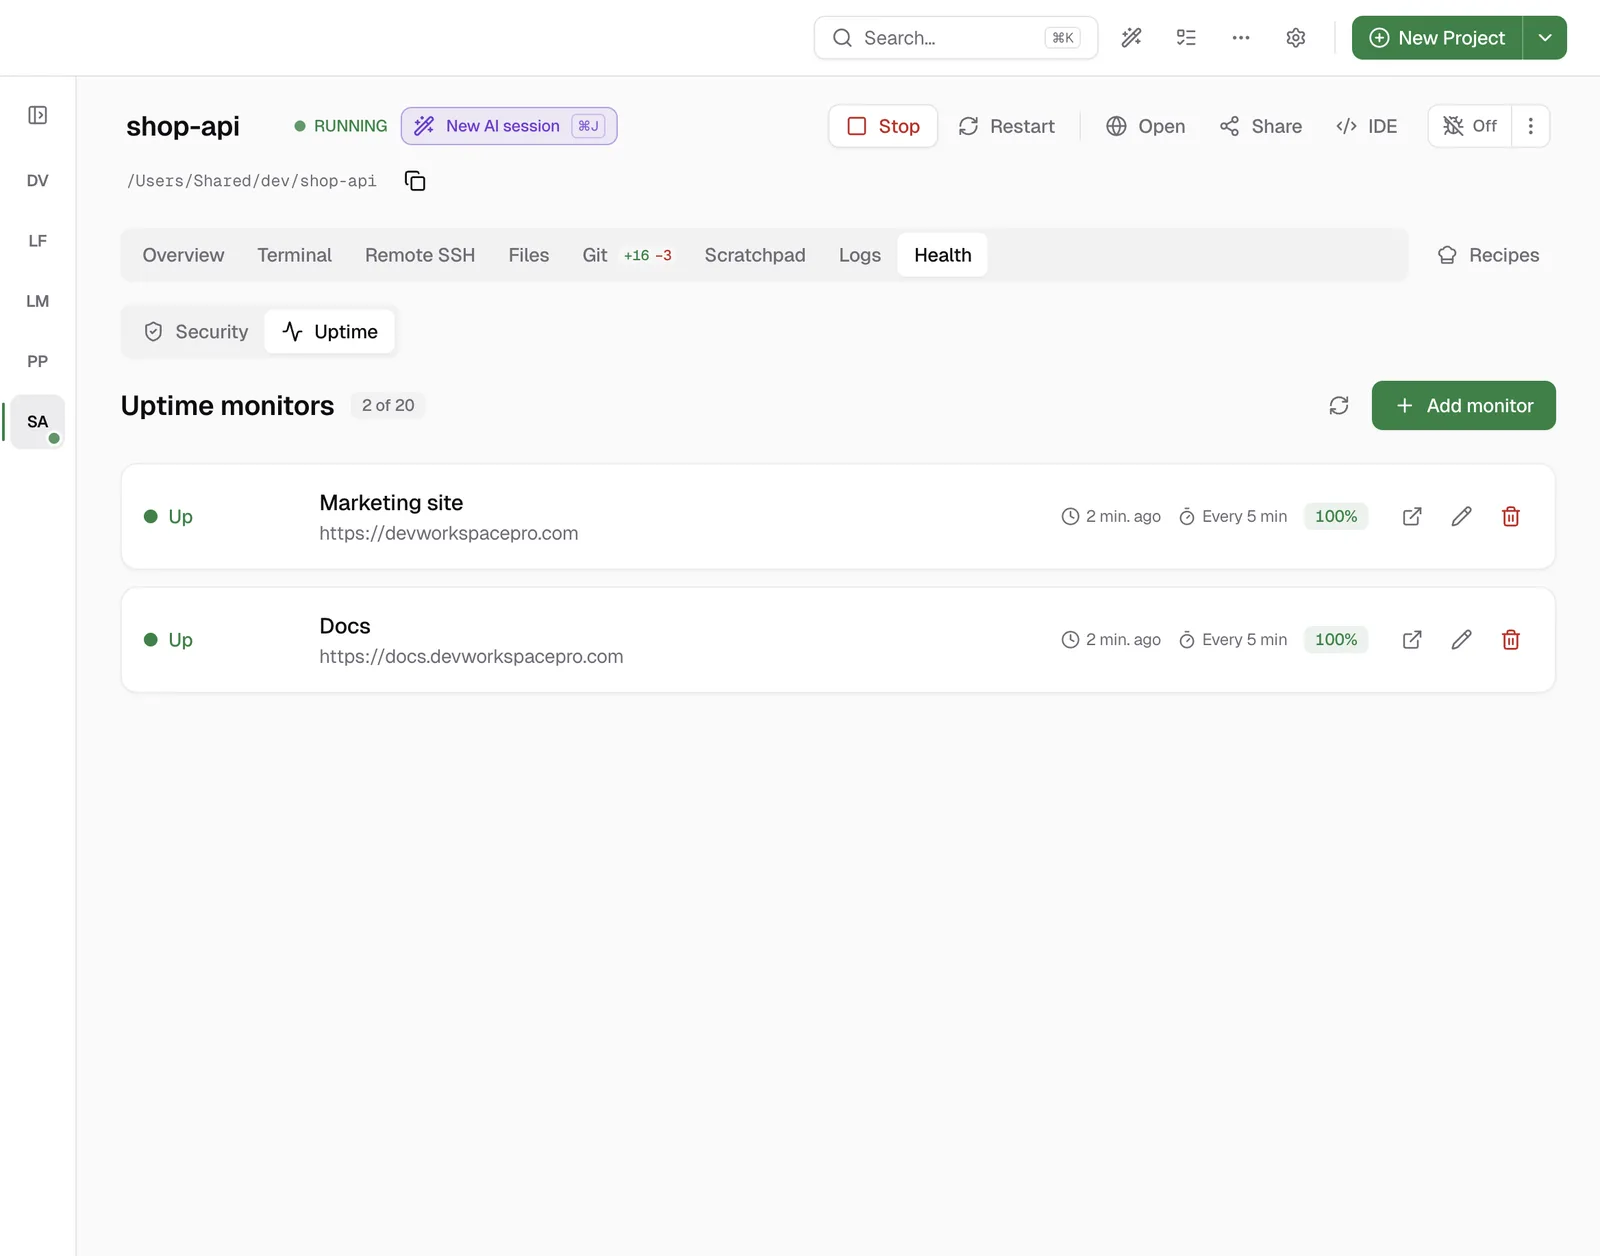
Add a monitor
- Open the project, then Health › Uptime.
- Click Add monitor.
- Enter a name and the URL.
- Set how often to check, and after how many failed checks you want the alert. The defaults are every 5 minutes and 3 failed checks.
- Click Add monitor.
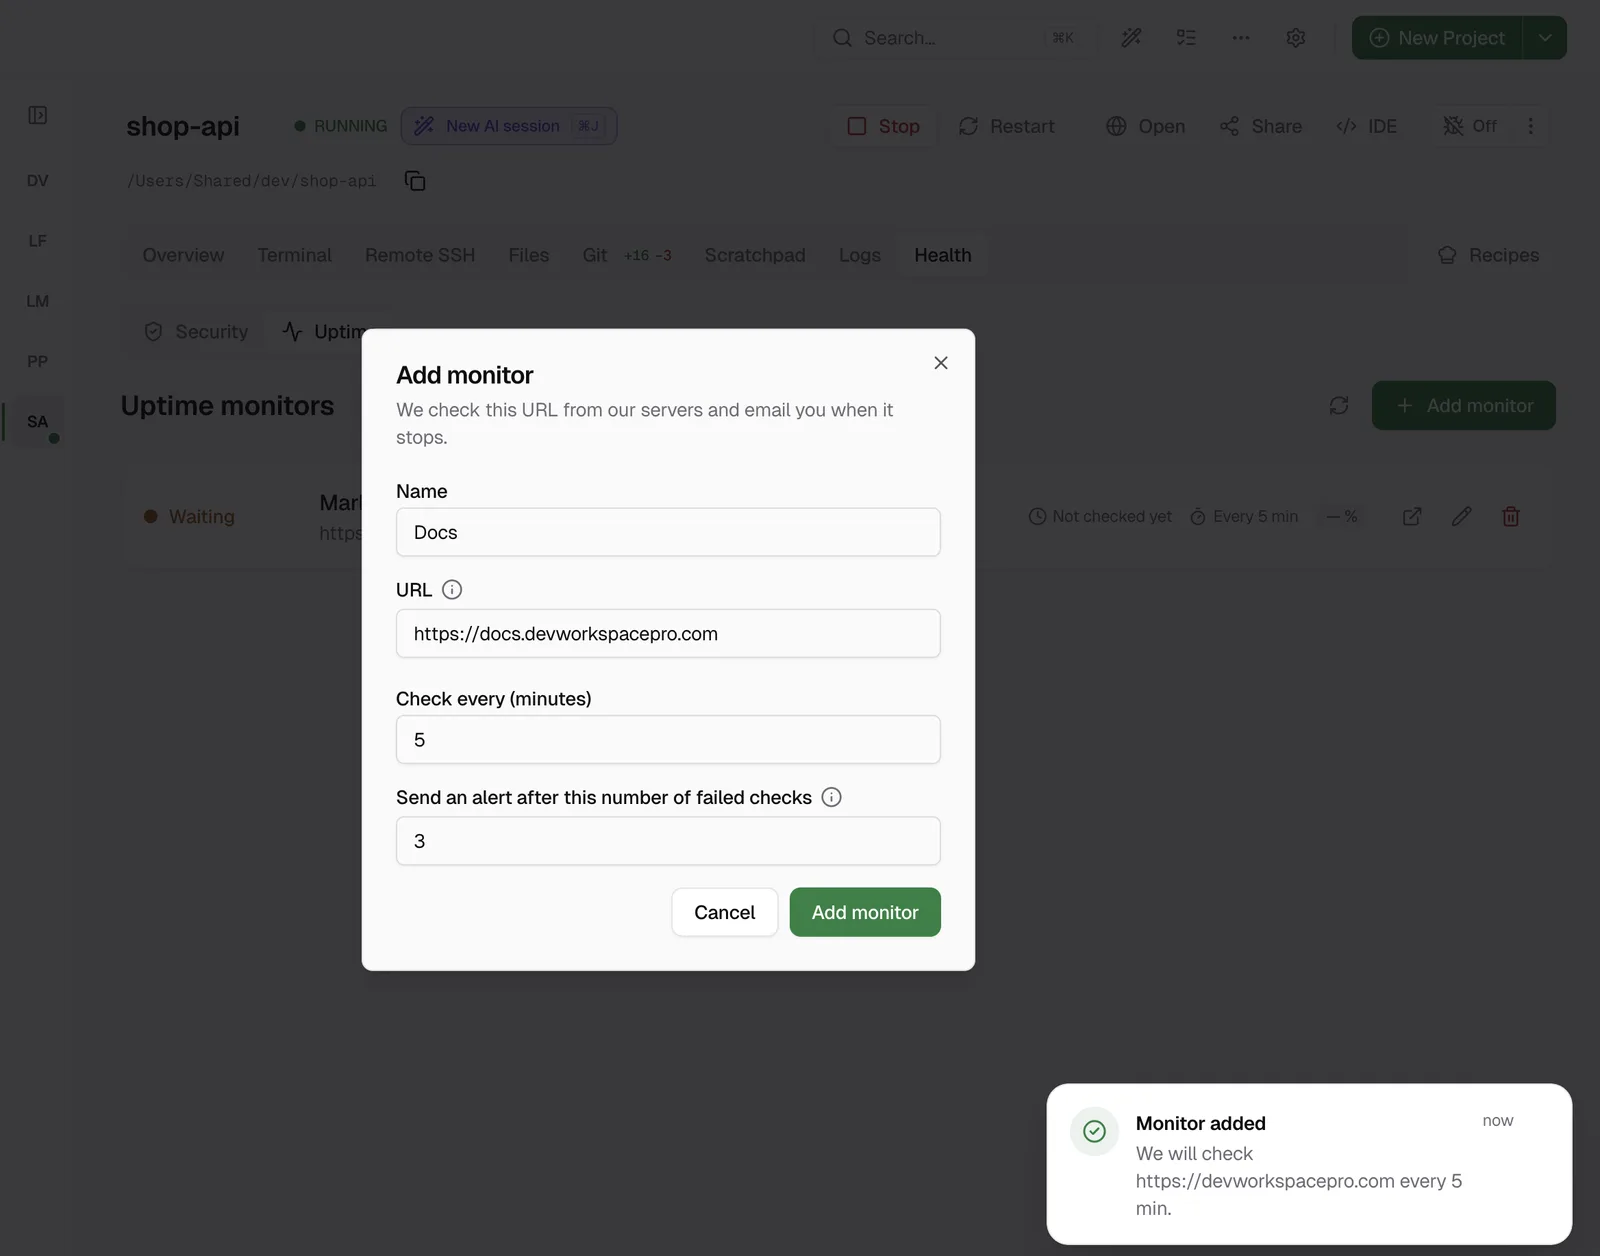
The URL must be public, because the checks run from our servers. The form does not accept a local URL such as *.ddev.site or localhost.
How the checks work
At each interval, our servers send a GET request to the URL. A 2xx response is a successful check, and redirects are followed. A check fails if the response is too slow, if the status is not 2xx, or if the connection fails.
Use a higher number of failed checks to ignore short outages. The alert comes only when that number of checks in a row fail. You get one Service Down email for each outage, with the name, the URL and the time of the first failed check. When the site comes back, you get a Service Restored email with the downtime in minutes.
What you need
An active licence. You can have 20 monitors for each licence, across all your projects. This is different from log monitoring, which reads the log files on your server from the app on your computer.
Learn more
- Uptime Monitoring in the docs has every field and limit.
- Pricing
FAQ
Frequently asked questions
How do I monitor my sites for downtime?
Open the project in DevWorkspace Pro, open Health, then Uptime, and click Add monitor. Enter the public URL and how often to check it. Our servers do the checks, and you get an email when the site stops.
Does my computer need to be on?
No. Our servers store the monitors and do the checks, so your computer can be off.
How many monitors can I have?
20 for each licence, across all your projects.